On this blog , i migrated from blocky to pihole. Overall, it work fine, pretty efficient memory as it store everything to ram on startup and minimal dependencies, unlike PiHole with their PHP deps, but also this making Blocky doesnt have any interface to interact on, by default you can just check Blocky docker logs, but it pretty ineffecient. Luckyly blocky had support to export the log to external resource like mysql, postgres, csv file. So how do we do it? First, of course updating our blocky config, may some of you already noticed, there is commented part of blocky config from previouse blog.
This part:
# Monitoring part
#prometheus:
#  enable: true
#  path: /metrics
#httpPort: 4000

#queryLog:
#  type: mysql
#  target: blockyuser:blockypass@tcp(192.168.0.2:3310)/blocky?charset=utf8mb4&parseTime=True&loc=Local
#  logRetentionDays: 30
Why there is two? Well the first part is Prometheus, blocky will export metrics to prometheus about it state, uptime, etc. Then the query log part this is where we can see what resolved, blocked and few other queries status. Before we enable the prometheus and querylog to mysql, we will prepare the compose for it.
# Blocky Monitoring Compose
version: "3.8"
services:
  db:
   image: martadinata666/mariadb:10.6
   volumes:
     - db:/var/lib/mysql
   ports:
     - 3310:3306
   environment:
     - MARIADB_ROOT_PASSWORD=blokcyroot
     - TZ=Asia/Jakarta
     - MARIADB_DATABASE=blocky
     - MARIADB_USER=blockyuser
     - MARIADB_PASSWORD=blockypass
   restart: always
   networks:
     - blocky

  prometheus:
    image: prom/prometheus
    volumes:
      - ./prometheus/:/etc/prometheus/
      - prometheus_data:/prometheus
    command:
      - '--config.file=/etc/prometheus/prometheus.yml'
      - '--storage.tsdb.path=/prometheus'
      - '--web.console.libraries=/usr/share/prometheus/console_libraries'
      - '--web.console.templates=/usr/share/prometheus/consoles'
    restart: always
    networks:
      - blocky

  # dont use latest, grafana 9 breaks sql queries.
  grafana:
    image: grafana/grafana:8.5.13
    depends_on:
      - prometheus
    ports:
      - 3001:3000
    volumes:
      - grafana_data:/var/lib/grafana
      - ./grafana/provisioning/:/etc/grafana/provisioning/
    environment:
      - GF_PANELS_DISABLE_SANITIZE_HTML=true
      - GF_INSTALL_PLUGINS=grafana-piechart-panel
    restart: always
    networks:
      - blocky

volumes:
    prometheus_data:
    grafana_data:
    db:

networks:
  blocky:
    name: blocky
Then before doing docker compose up -d, we need setup few things again.
Creating prometheus.yml
global:
  scrape_interval:     15s
  evaluation_interval: 15s

scrape_configs:
  - job_name: 'blocky'
    static_configs:
    - targets: ['your-blocky-host-ip:4000']
Creating datasource.yml for grafana
# config file version
apiVersion: 1
deleteDatasources:
  - name: Prometheus
    orgId: 1

datasources:
- name: Prometheus
  type: prometheus
  access: proxy
  orgId: 1
  url: http://prometheus:9090
  isDefault: true
  jsonData:
     graphiteVersion: "1.1"
     tlsAuth: false
     tlsAuthWithCACert: false
  version: 1
  editable: true
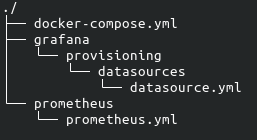
You can see structure by the images here:

Then we can do docker compose up -d, don't forget to check the container logs, in case something not started correctly.
You need to manually add mysql datasource as it may different per person, such as mysql container name, mysql ip or port
Then we need to import 2 dashboard to grafana:
You can import using the ID 13768 and 14980 or Download json and import.
Now we enable the blocky, config to:
# Monitoring part
prometheus:
  enable: true
  path: /metrics
httpPort: 4000

# Notice this target, you may need to adjust it depends on you host ip.
queryLog:
  type: mysql
  target: blockyuser:blockypass@tcp(monitor-host-ip:monitor-mysql-port)/blocky?charset=utf8mb4&parseTime=True&loc=Local
  logRetentionDays: 30
And restart our blocky container, then wait about 5 minutes or so, our data will be collected.
What is it look like? Here some screenshoot of it:
Prometheus
Query Log
sources:
- blocky configuration docs
- grafana prometheus example #outdated, half of it works
- blocky prometheus dashboard
- blocky query dashboard


